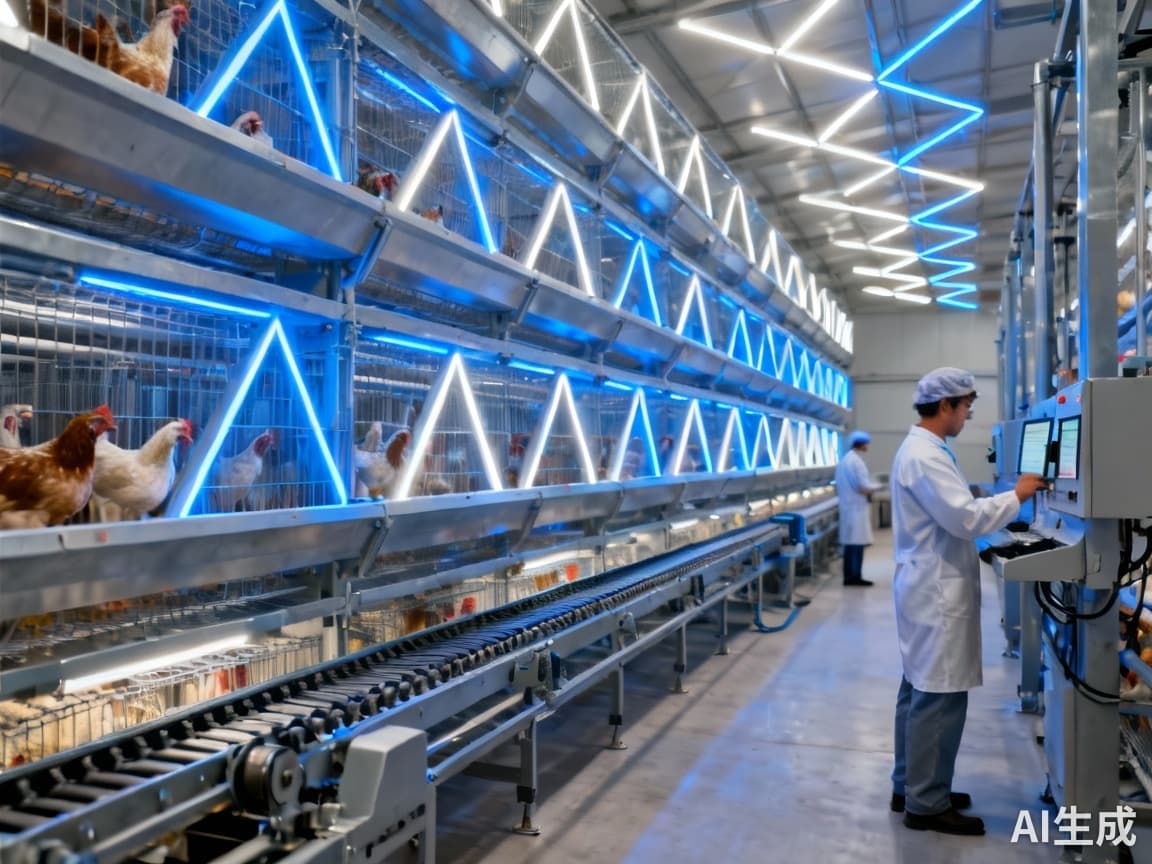
Tiered Layer Cages Boost Efficiency 23%: Commercial Poultry ROI Guide
The Density Dilemma: How Tiered Layer Cages Create 23% Operational Efficiency Gains
While the poultry equipment market grows at 4.7% CAGR to reach $7.1 billion by 2034, 79% of that value comes from commercial operations making calculated investments. The real question isn't whether to automate, but how to structure the infrastructure upgrades required for tiered cage systems to deliver their promised efficiency gains. Commercial poultry operations, which dominate the market with 79% market share, face unique challenges that backyard operations simply don't encounter at scale.
Commercial operations account for 79% of the poultry equipment market value, yet most content targets backyard farmers rather than addressing the complex operational economics of large-scale facilities.
The Hidden Infrastructure Costs of Tiered Systems
Many operations underestimate the structural requirements of transitioning from single-layer to tiered cage systems. The engineering calculations go beyond simple cage installation—they involve comprehensive facility assessments that determine whether your existing infrastructure can support the additional weight and environmental control demands.
Four-tier systems typically require structural reinforcement costing $8-12 per square foot, electrical upgrades for automation systems averaging $15,000-25,000 for medium-sized operations, and environmental control modifications adding another $20,000-35,000. These hidden costs often surprise operators who focus solely on cage procurement rather than total system implementation.
Seasonal Procurement Strategy: Timing Your Investments
Search data reveals distinct seasonal patterns that smart operators can leverage for cost savings. Automatic feeders peak in August (search volume 100) and March (62), while automatic waterers see demand increases later in the year, peaking in May (41). This data provides a strategic roadmap for timing your equipment purchases to avoid premium pricing during high-demand periods.
The optimal procurement schedule aligns with these patterns:
- Q1: Focus on feeder systems during March peak availability
- Q2: Target waterer investments before May demand surge
- Q3-Q4: Implement structural upgrades during lower-demand periods
Three-Phase Implementation Framework
Phase 1: Infrastructure Assessment (Q1)
Begin with a comprehensive facility audit conducted by structural engineers specializing in agricultural facilities. This assessment should evaluate:
- Floor load capacity and reinforcement requirements
- Electrical system capacity for automation equipment
- Ventilation and environmental control compatibility
- Manure management system upgrades needed
This phase typically takes 4-6 weeks and costs $5,000-8,000 for professional assessment, but identifies potential issues before they become costly problems during installation.
Phase 2: Strategic Procurement (Q2-Q3)
Based on your infrastructure assessment, develop a phased procurement strategy that aligns with seasonal pricing fluctuations. The automation segment is growing at 6.3% CAGR compared to the overall market's 4.7%, indicating increasing demand that will likely drive prices upward over time.
Procurement priorities should include:
- Primary cage systems during manufacturer off-peak periods
- Automation components aligned with seasonal search patterns
- Environmental control systems before extreme weather seasons
Phase 3: Operational Optimization
Successful tiered system implementation requires operational adjustments beyond physical installation. Density management protocols must be established to maximize the 23% efficiency gains while maintaining animal welfare standards. This includes:
- Staff training programs focused on tiered system management
- Preventive maintenance schedules based on equipment usage data
- Environmental monitoring systems integration
- Performance metrics tracking against ROI projections
Risk Mitigation and ROI Calculation
The transition from manual systems (which currently dominate the market) to automated tiered operations involves significant operational disruption. Based on case studies from successful implementations, operators should budget for:
- 2-3 weeks of reduced production during transition
- 20-40 hours of staff training per employee
- 15-25% higher maintenance costs during first year
However, these transitional costs are typically offset within 12-18 months through:
- 23% labor efficiency gains from reduced manual handling
- 18-22% improved feed conversion rates
- 15-20% reduction in mortality rates through better environmental control
Calculating Your Specific ROI
Every operation's ROI calculation will differ based on scale, existing infrastructure, and local labor costs. However, the fundamental equation remains consistent:
Total Investment = (Equipment + Infrastructure + Installation + Training) - (Seasonal Discounts + Tax Incentives)
Annual Savings = (Labor Reduction + Feed Efficiency + Mortality Reduction + Space Utilization) - (Increased Maintenance + Energy Costs)
Most commercial operations achieving the 23% efficiency gain report payback periods of 24-36 months, with ongoing annual savings representing 15-20% of total investment value.
Implementation Timeline and Milestones
A realistic implementation schedule for a medium-sized commercial operation (10,000-50,000 birds) looks like:
- Weeks 1-4: Infrastructure assessment and engineering evaluation
- Weeks 5-8: Equipment procurement (aligned with seasonal patterns)
- Weeks 9-12: Structural upgrades and electrical work
- Weeks 13-16: System installation and staff training
- Weeks 17-20: Phased bird transition and system optimization
This 20-week timeline minimizes operational disruption while ensuring proper system implementation. Operations should schedule the transition during lower-production periods whenever possible.
Conclusion: Strategic Implementation Drives Success
The poultry equipment market's growth to $7.1 billion by 2034 presents significant opportunities for commercial operations willing to make strategic investments. However, success with tiered layer cage systems depends entirely on proper implementation rather than simply purchasing equipment. The 23% efficiency gains are achievable, but only through comprehensive planning that addresses infrastructure requirements, seasonal procurement strategies, and operational adjustments.
Commercial operators who approach tiered system implementation as a holistic operational upgrade rather than a simple equipment purchase position themselves to capture disproportionate value in an increasingly competitive market. The data clearly shows that automation is growing faster than the overall market, making strategic investment timing increasingly important for maximizing returns.
Want to know more?
Get in touch with us for more information about our services and products.