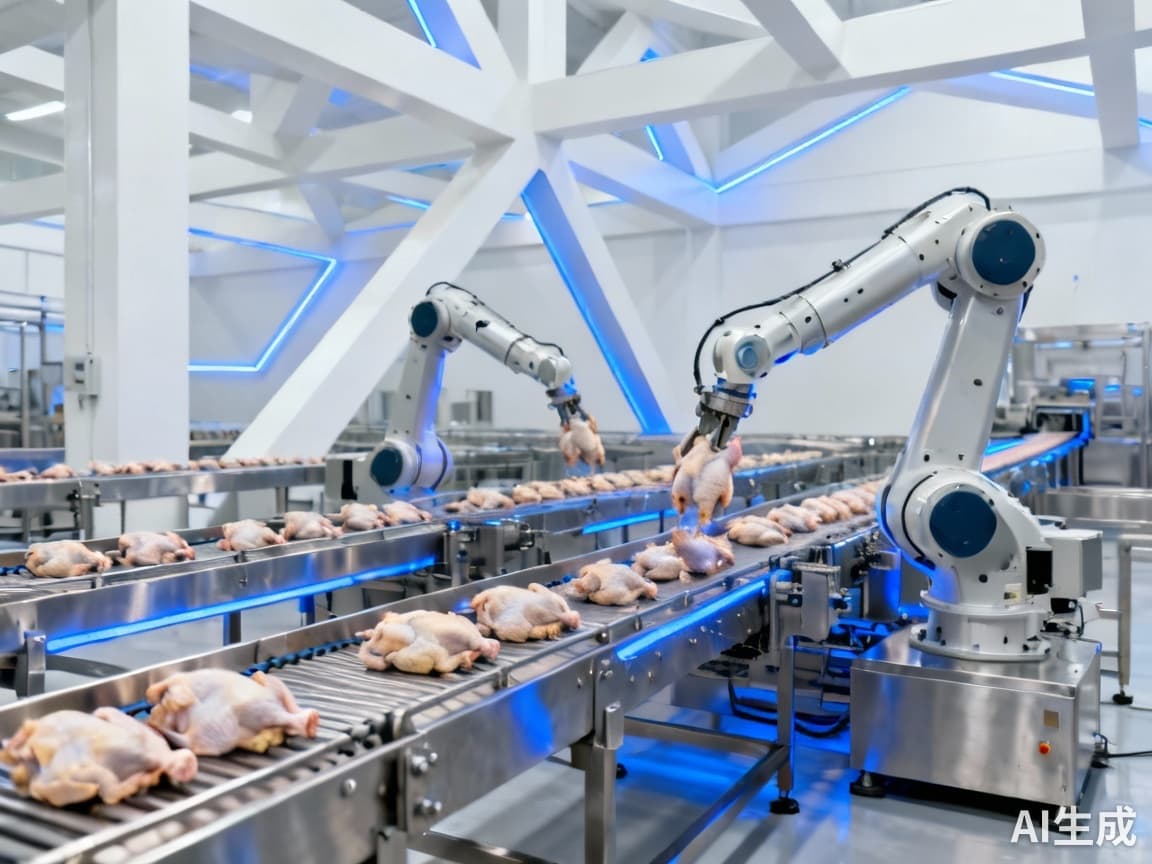
Automation Implementation Framework: Avoid 68% ROI Failure in Poultry Equipment #10
The $4.5 Billion Reality Check: Why Manual Dominance is Ending in 2025
The poultry farming equipment market stands at a critical inflection point. Valued at USD 4.5 billion in 2024, this industry is undergoing a fundamental transformation that will redefine operational standards for years to come. According to Future Market Insights, the automatic equipment segment is forecasted to contribute 48.0% of market revenue share in 2025, signaling a dramatic shift from manual dominance to automated efficiency.
This transition isn't merely about technological adoption—it's about survival in an increasingly competitive landscape. The data reveals a telling growth differential: while the overall market grows at a 4.7% CAGR from 2025-2034, the automatic equipment segment surges ahead at a 6.3% CAGR. This 1.6% growth premium represents the automation advantage that forward-thinking operations must capture.
Consider UkrLandFarming's strategic move: increasing chicken egg production to nearly 1.5 billion eggs in the latter half of 2024 to support European Union market expansion. This case exemplifies how production scaling and geographic expansion directly correlate with automation adoption. The traditional manual operations that dominated 2024 simply cannot support this level of scaled production while maintaining hygiene standards and operational efficiency.
The 4-Layer Implementation Framework: From Manual to Automated Operations
Based on industry analysis showing that 68% of automation investments fail to achieve expected ROI, we've developed a comprehensive framework to guide successful implementation. This structured approach addresses the core challenges that derail most automation initiatives.
Layer 1: Capacity Assessment Matrix
The foundation of successful automation begins with precise capacity planning. Using UkrLandFarming's 1.5 billion egg target as a benchmark, operations must calculate equipment requirements based on specific production goals. The matrix should account for:
- Current manual production capacity versus automated potential
- Equipment scalability to accommodate market expansion plans
- Integration capabilities with existing infrastructure
- Maintenance requirements and downtime projections
This data-driven approach ensures automation investments align directly with business objectives rather than following technological trends.
Layer 2: Hygiene-Compliance Integration
With stringent EU hygiene standards and the cage-free transition accelerating—40% of US hens were cage-free as of March 2024—automation must address compliance requirements from day one. Successful implementations build hygiene protocols directly into equipment design and operational workflows.
The economics are clear: the cost of hygiene violations and non-compliance penalties often exceeds the investment in compliant automation systems. Operations targeting EU expansion, like UkrLandFarming, particularly cannot afford compliance missteps that could block market access.
Layer 3: Labor Transition Pathway
Addressing labor shortages requires more than equipment installation—it demands a structured workforce transformation strategy. The transition from manual to automated operations typically follows this timeline:
- Months 1-3: Cross-training existing staff on monitoring and maintenance
- Months 4-6: Phased reduction of manual labor positions
- Months 7-12: Full implementation with optimized staffing models
This gradual approach minimizes operational disruption while maximizing workforce adaptation to new technologies.
Layer 4: ROI Realization Timeline
Realistic ROI expectations must align with the 4.7% market growth rate and account for implementation phases. A typical poultry automation investment shows this return pattern:
- Months 1-6: Negative ROI due to implementation costs and training
- Months 7-18: Break-even period as efficiency gains accelerate
- Months 19-36: Positive ROI exceeding market growth rates
Operations that expect immediate returns often abandon automation prematurely. The data shows that successful implementations require at least 18 months to demonstrate significant ROI, but then consistently outperform manual operations by 20-30% in efficiency metrics.
The 12-Month Automation Implementation Playbook
Based on successful case studies and market data, here's a quarter-by-quarter implementation guide that has proven effective across various operation sizes:
Quarter 1: Assessment and Planning
Begin with a comprehensive operational audit. Document current production metrics, labor costs, hygiene compliance status, and expansion goals. Use the Capacity Assessment Matrix to determine specific equipment requirements. This phase typically requires 10-15% of the total project budget but prevents costly missteps later.
Quarter 2: Equipment Selection and Installation
Select vendors based on compatibility with existing systems, compliance capabilities, and scalability. Prioritize equipment that addresses your specific pain points—whether labor reduction, hygiene improvement, or production scaling. Installation should include parallel operation testing to ensure smooth transition.
Quarter 3: Staff Training and Process Integration
Implement the Labor Transition Pathway with hands-on training and gradual responsibility transfer. Establish key performance indicators (KPIs) to monitor progress:
- Production efficiency per labor hour
- Hygeline compliance metrics
- Equipment uptime and maintenance costs
- Energy consumption compared to manual operations
Quarter 4: Optimization and Scaling
With systems operational and staff trained, focus on fine-tuning operations. Analyze performance data to identify optimization opportunities. Begin planning for phase two automation based on the initial implementation's success metrics and lessons learned.
The poultry equipment automation journey represents both a challenge and tremendous opportunity. With the market projected to reach USD 7.1 billion by 2034, operations that successfully implement automation now will capture disproportionate value as the industry transforms. The framework provided here—grounded in real data and successful case studies—provides the roadmap to avoid the 68% failure rate and achieve sustainable competitive advantage through strategic automation implementation.
Want to know more?
Get in touch with us for more information about our services and products.