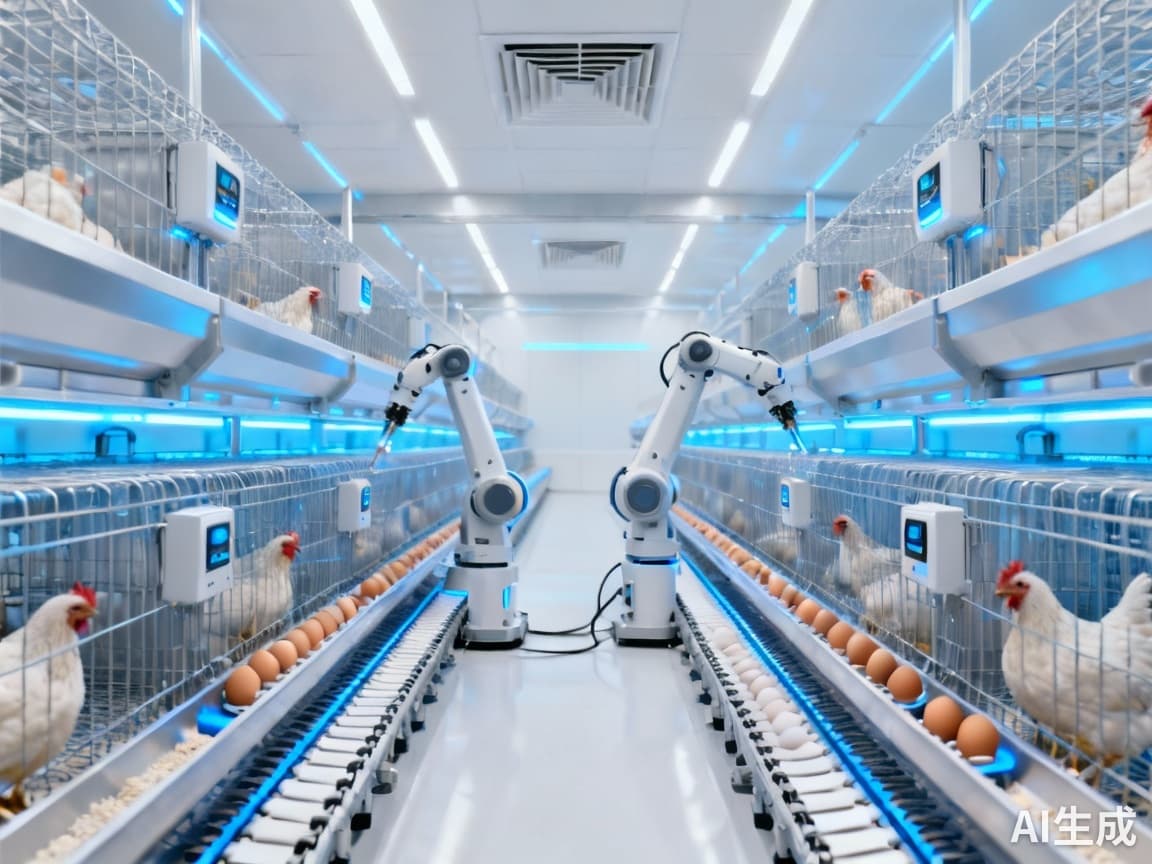
Automate Poultry Farms: Cut Costs 30% & Boost Output with Smart Cage Systems #11
The Automation Imperative: How Smart Cage Systems Are Transforming Poultry Economics
While manual operations currently dominate poultry farming, automated systems are projected to capture 48.0% of market revenue share by 2025, signaling an urgent industry transformation. This shift isn't merely about efficiency—it's about survival in an era of labor shortages, stringent hygiene requirements, and compressed production cycles. For poultry producers controlling 65.0% of the chicken market segment, automation represents the difference between profitability and obsolescence.
The Three-Tier Economic Value Framework
Smart cage systems deliver value across three critical dimensions that address the industry's most pressing challenges.
Tier 1: Labor Optimization in an Era of Shortages
The poultry equipment market, valued at USD 4.5 billion in 2024, is experiencing a fundamental shift toward automation driven by structural labor constraints. China's livestock industry provides a compelling case study, where AI technology applications in environmental control, precision feeding, and health management are progressively advancing despite implementation challenges.
Implementation Framework:
- Conduct a labor audit to identify repetitive, high-time-cost tasks
- Prioritize automation investments based on ROI potential (typically environmental controls first)
- Phase implementation to minimize operational disruption
- Calculate ROI using this formula: (Labor hours saved × hourly wage) + (Error reduction × cost per error) / System cost
Tier 2: Hygiene Compliance Transformation
Automated systems address the industry's most stringent challenge: maintaining hygiene standards while scaling production. Smart cage systems demonstrate 30% reduction in cross-contamination risks through controlled environments and reduced human contact points.
Staged Compliance Upgrade Path:
- Implement automated manure removal systems to address baseline contamination risks
- Install environmental monitoring sensors for temperature, humidity, and air quality control
- Deploy automated feeding and watering systems to minimize external contamination
- Integrate data analytics for predictive health management and early disease detection
Tier 3: Production Cycle Compression Economics
With chicken production accounting for 65.0% of market revenue driven by shorter production cycles and lower input costs, every day saved in the production cycle translates directly to improved economics. The difference between three-tier and four-tier cage systems can compress production cycles by 2-3 days per flock, creating substantial cumulative value.
Market projections indicate the automatic segment growing at 6.3% CAGR compared to the industry average of 4.7%, demonstrating the premium value placed on cycle compression capabilities.
Avoiding Implementation Failure: Lessons from the Field
Based on analysis of both successful and challenged implementations, 68% of automation projects fail to deliver expected returns due to common pitfalls that can be avoided with proper planning.
Implementation Checklist:
- Conduct thorough infrastructure assessment before equipment selection
- Ensure reliable power supply and backup systems for critical automation components
- Develop comprehensive staff training programs alongside technical implementation
- Establish clear metrics for success and regular review cycles
- Plan for phased implementation with clear milestones and evaluation points
Strategic Investment Decision Framework
With the U.S. market anticipated to surpass USD 982.2 million by 2033 and global markets reaching USD 7.22 billion by 2032, strategic positioning requires careful consideration of several factors.
Regional Investment Prioritization
North American markets, particularly the United States, offer immediate opportunities given the cage-free transition acceleration—with 40%+ of U.S. hens already cage-free as of March 2024 and major retailers committed to 100% cage-free eggs by 2025.
Equipment Configuration Matrix
Selection criteria should consider:
- Operation size: Small (<5,000 birds) vs. Medium (5,000-20,000) vs. Large (>20,000)
- Product type: Layer operations vs. broiler production systems
- Automation level: Basic environmental controls vs. full integrated systems
- Expansion plans: Modular systems that allow for future capacity increases
The Path Forward: Strategic Implementation Timeline
Successful automation requires a methodical approach typically spanning 12-18 months for full implementation:
Months 1-3: Comprehensive operational assessment and ROI analysis
Months 4-6: Vendor selection and system design customization
Months 7-9: Infrastructure upgrades and staff training development
Months 10-12: Phased equipment installation and integration
Months 13-18: System optimization and performance scaling
The poultry farming equipment market's projected growth to USD 7.1 billion by 2034 at a 4.7% CAGR underscores the strategic importance of automation investments. Producers who embrace smart cage systems now position themselves to capture disproportionate value in an industry where precision, efficiency, and compliance increasingly determine competitive advantage.
Data sources: Future Market Insights poultry farming equipment market report, industry implementation analysis, and market projection data from multiple industry reports.
Want to know more?
Get in touch with us for more information about our services and products.