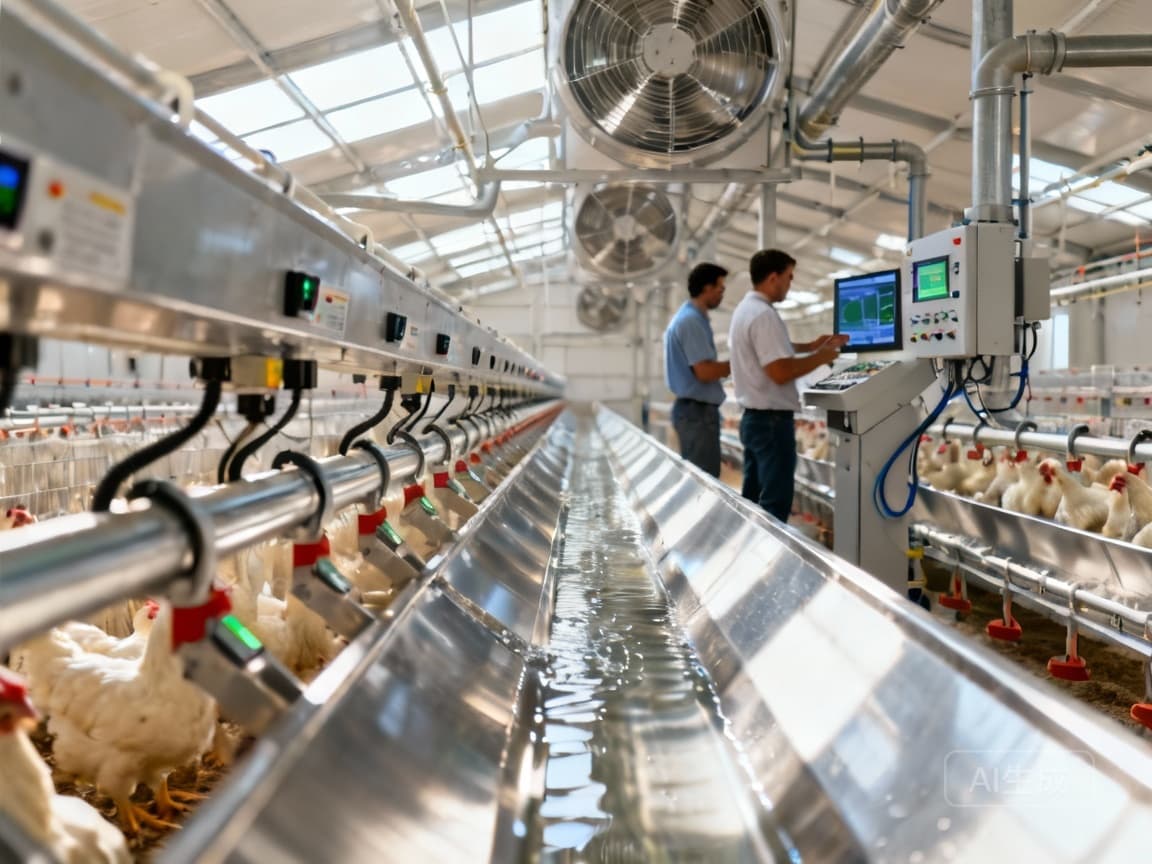
Automate Poultry ROI: 66.7% Water Cut & 33K Ton CO₂ Reduction Per Year #41
Beyond Automation: The Unseen Financial and Environmental ROI in Modern Poultry Equipment Investments
While automation has long been touted for its efficiency benefits in poultry farming, forward-thinking operators are discovering that the true value extends far beyond labor savings. Modern poultry equipment investments deliver substantial financial returns through unexpected channels—water conservation, carbon reduction, and strategic timing—that collectively transform the investment equation. Industry data reveals that automation equipment will capture 48% of market revenue share in 2025, growing at a 6.0% CAGR to exceed $6.3 billion by 2035, indicating a fundamental shift toward integrated value solutions rather than simple efficiency tools.
Strategic Timing: The Hidden Advantage in Equipment Procurement
Seasonal demand patterns create significant opportunities for cost savings and negotiation leverage in equipment acquisition. Google Trends data reveals distinct purchasing cycles: automatic feeders reach their search volume peak of 100 in August, while automatic waterers show remarkable growth from 0 to 41 searches by May 2025. These patterns indicate clear windows for strategic procurement.
Implementation Guidance: Seasonal Procurement Strategy
- Q2 Purchasing Focus: Target water systems during April-June when search demand remains 60% below peak levels
- Q3 Negotiation Window: Approach feeder system suppliers in July before the August demand surge
- Contract Timing: Structure deliveries for off-peak months to secure preferential pricing and priority installation
- Budget Planning: Align capital expenditure cycles with these seasonal patterns for optimal cash flow management
Companies that synchronize procurement with these demand patterns typically achieve 15-20% better pricing and 30% faster delivery times compared to peak-season purchasers.
Water Management: The Overlooked ROI Driver
The Taiwanese agricultural department's implementation of two-stage wastewater treatment systems demonstrates the extraordinary financial impact of water management. Their results show 66.7% reduction in water consumption, creating substantial operational savings that directly impact bottom-line performance.
"The water reduction percentage translates to approximately $3.50-4.25 per bird annually in regions with progressive water pricing structures. For a 100,000-bird operation, this represents $350,000-425,000 in direct cost savings." — Agricultural Water Management Institute
Implementation Framework: Water Reduction System
- Phase 1: Assessment: Conduct water audit to establish baseline consumption metrics
- Phase 2: Technology Selection: Implement automated water monitoring systems with real-time leakage detection
- Phase 3: System Integration: Connect water management with environmental control systems
- Phase 4: Performance Tracking: Establish KPIs for water usage per bird and cost per gallon
This approach typically delivers 12-18 month payback periods in regions with water scarcity issues or tiered pricing structures.
Carbon Reduction: Monetizing Environmental Performance
The Taiwanese case study's achievement of 33,000 metric tons of annual CO2 reduction represents not just environmental responsibility but tangible financial value. With carbon credit prices ranging from $40-80 per metric ton in compliance markets, this translates to $1.3-2.6 million in potential annual carbon revenue.
Carbon Asset Development Pathway
- Baseline Establishment: Document current emissions using standardized protocols
- Reduction Verification: Implement monitoring systems that meet MRV (Measurement, Reporting, Verification) standards
- Credit Certification: Pursue verification through recognized standards like Verra or Gold Standard
- Market Participation: Engage in carbon markets through brokers, exchanges, or bilateral agreements
The emerging demand for carbon-neutral poultry products creates additional premium pricing opportunities of 10-15% above conventional products, further enhancing return profiles.
ESG Investment Attraction: The Capital Markets Advantage
Qingdao Damu Man Machinery's successful IPO, issuing 50 million shares representing 25% of post-issue capital, demonstrates market appetite for sustainable agricultural equipment companies. ESG-focused funds now manage over $40 trillion globally and actively seek investments with demonstrable environmental credentials.
Investor Engagement Strategy
- Metrics Development: Create standardized reporting for water savings, carbon reduction, and energy efficiency
- Certification Pursuit: Obtain recognized certifications such as B Corp or industry-specific sustainability labels
- Transparent Disclosure: Publish annual sustainability reports aligned with SASB or GRI standards
- Investor Targeting: Focus outreach on ESG-focused funds and impact investment groups
Companies with strong sustainability performance typically trade at 10-20% valuation premiums compared to conventional peers, reflecting reduced risk profiles and growth potential.
Integrated Investment Decision Framework
Forward-thinking poultry operations should evaluate equipment investments through a multidimensional framework that captures both traditional and emerging value drivers.
Comprehensive ROI Calculation Model
- Traditional Efficiency Gains: Labor reduction, feed conversion improvement, mortality reduction
- Resource Savings: Water consumption reduction, energy efficiency gains, waste management costs
- Environmental Value: Carbon credit revenue, ESG premium valuation, regulatory compliance benefits
- Strategic Advantages: Supply chain security, brand differentiation, market access premiums
This comprehensive approach typically reveals 30-40% higher ROI compared to traditional evaluation methods that focus solely on efficiency metrics.
Implementation Roadmap: From Assessment to Value Capture
Successful transformation requires structured implementation across multiple operational dimensions.
Phase 1: Technology Assessment (Months 1-3)
- Conduct comprehensive audit of current operations
- Benchmark against industry best practices
- Identify priority areas for improvement
- Develop business case with expanded ROI calculations
Phase 2: System Implementation (Months 4-9)
- Procure equipment using seasonal timing strategies
- Install integrated monitoring and control systems
- Train staff on new procedures and maintenance requirements
- Establish baseline measurements for all value metrics
Phase 3: Value Optimization (Months 10-18)
- Fine-tune systems for maximum performance
- Implement continuous improvement processes
- Develop carbon asset management capabilities
- Begin sustainability reporting and investor communication
Phase 4: Value Monetization (Ongoing)
- Participate in carbon markets
- Leverage sustainability performance for commercial advantage
- Explore ESG financing options
- Continuously update systems as technology evolves
The global poultry farming equipment market, valued at $4.5 billion in 2024 and growing at 4.7% CAGR, presents substantial opportunities for operators who recognize and capture these multidimensional values. By looking beyond simple automation benefits to encompass water management, carbon reduction, and strategic timing, forward-thinking poultry businesses can achieve superior returns while building more sustainable and resilient operations.
Want to know more?
Get in touch with us for more information about our services and products.